
Visual Presentation: How to Make Slides People Get at a Glance
A visual presentation carries its message through charts, images, and diagrams people understand in seconds. The key is the message, not the number of pictures.

What is a visual presentation
A visual presentation is one that carries its main message through charts, images, diagrams, and layout rather than through paragraphs on the slides. The speaker still explains with words, but each slide works as evidence the audience can take in at a glance: one chart that shows growth, one photo of real conditions, or one flow diagram that sums up a process.
Making one comes down to four steps. First, write the message of each slide as a single sentence. Second, choose the visual form that fits that message (bars for comparisons, lines for trends, diagrams for processes). Third, remove everything that does not support the message, including 3D effects and decoration. Fourth, check readability from a distance, especially font size and color contrast.
A visual presentation is not the same as a presentation full of pictures. A slide with five random photos is harder to follow than a plain text slide. The test is simple: can the audience grasp the point of the slide in a few seconds without reading your notes? If so, the slide is visual. This guide covers choosing charts, building the story, picking images, and checking contrast, with a sample outline for a monthly team meeting.
When a visual presentation works best
Almost every presentation benefits from visuals, but the payoff is biggest when you have data, a process, or a comparison that is hard to explain in sentences. Monthly sales reviews, customer survey results, project updates, and science lessons are common examples.
In a business presentation, managers and partners want the key numbers fast. A simple bar chart comparing target and actual is quicker to read than a twenty-row table. In a meeting presentation, a flow diagram helps attendees understand the stages of a project without a long explanation for every step.
For teachers, visual material helps students remember concepts. One clean diagram of the water cycle often sticks better than three paragraphs of definitions. The teaching presentation template guide shows how to plan lesson slides.
Visuals help less when the message is a quotation, a legal definition, or wording that must be read exactly. In that case, show the text in a large font and pause so people can read it. Do not force icons or charts onto a slide just to make it look busy.
Scroll the table sideways to see every column.
| Element | Works for | Avoid when |
|---|---|---|
| Bar chart | Comparing several categories (branches, products, teams) | You need more than one time series in the same chart |
| Line chart | Monthly or yearly trends | The data points are not at equal intervals |
| Pie chart | Shares of one meaningful whole | There are more than five categories or the slices are similar in size |
| Photo | Showing a real product, place, or condition | The photo is decoration with no link to the message |
| Icon | Marking a category that repeats across slides | The icon has no label and its meaning is unclear |
| Flow diagram | Processes, stages, or decision paths | There are more than six steps on one slide |
Use the table above as a quick reference when deciding what goes on each slide.
Start with the message, not the picture
The most common mistake in a visual presentation is hunting for images first and building the story around them. The slides look full, but the message gets lost. A safer order is: write the message, find the evidence, then choose the visual.
Write each slide title as a full sentence that states the takeaway, such as "Orders grew in Q3" instead of "Sales Data". A sentence title tells the audience what to look for in the chart. It also forces you to keep one message per slide. If you cannot state the point in one sentence, the slide probably needs to be split.
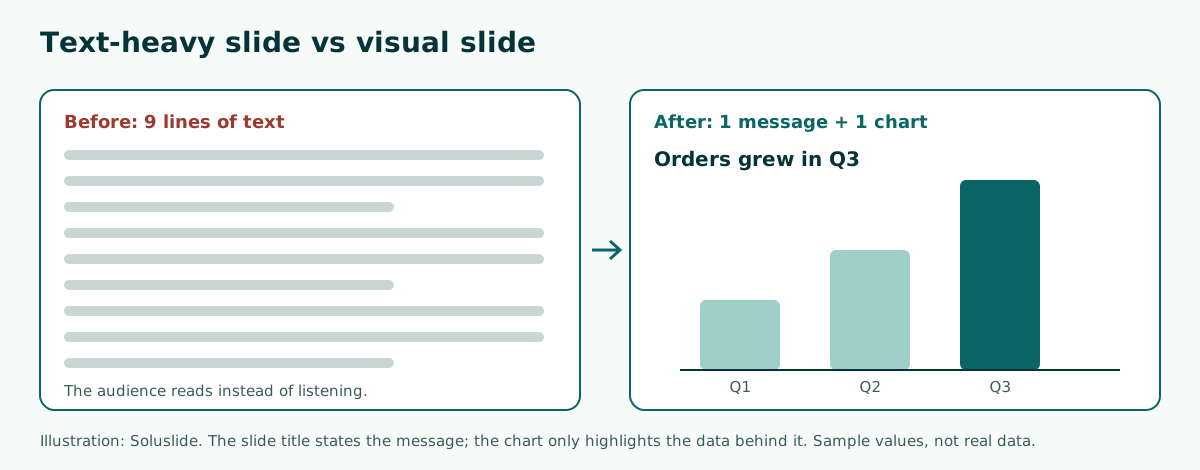
Once the message is clear, gather the evidence behind it: sales figures, survey results, a site photo, or a customer quote. That evidence is what becomes the visual. The overall arc from opening to close is covered in the presentation structure guide.
How to choose the right chart
Charts are the backbone of any data-driven visual presentation. The UK Analysis Function data visualisation guidance gives practical rules. Bar charts work well when comparing the size of different categories. Line charts are mainly used for time series, and when you have more than one time series, lines show the data better than clustered bars.
Pie charts come with stricter conditions. According to the same guidance, use a pie chart only when there are five categories or fewer, the categories add up to a meaningful whole, and one category is dominant. If several slices are similar in size, use a bar chart instead. Rank the slices by size, start the first one at the 12 o'clock position, and label the slices directly rather than using a key.
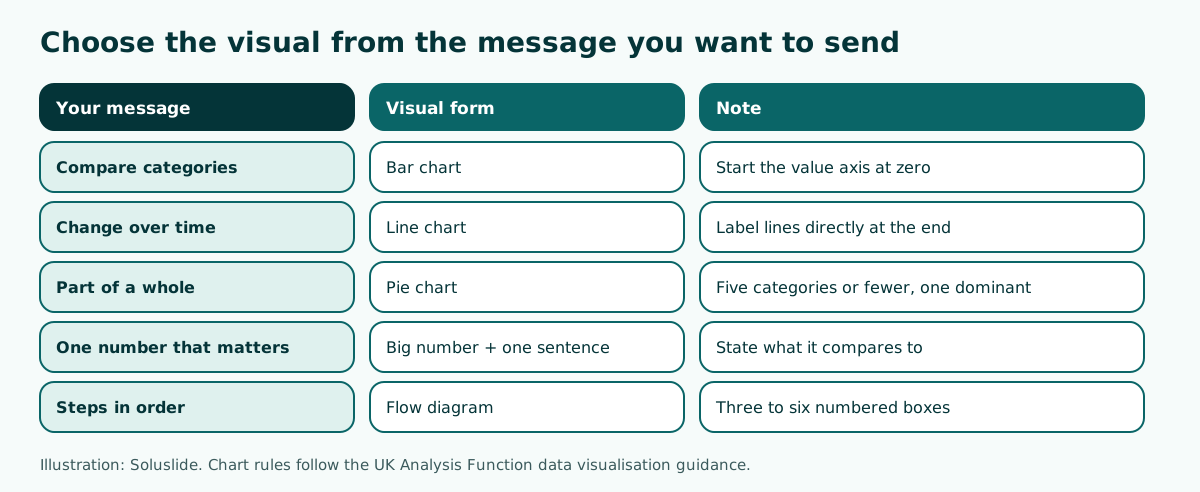
For bar charts, start the value axis at zero. The guidance explains that breaking the axis on a bar chart distorts the relative proportions of the bars, so a small difference looks large. The mechanics of building charts in PowerPoint are in how to make a graph in PowerPoint, and data that must be read value by value belongs in a table, as shown in how to make a table in PowerPoint.
Simplify charts so they read fast
Default charts in presentation software often include things nobody needs: heavy gridlines, a legend in the corner, shadows, and 3D effects. The Analysis Function guidance explicitly says to avoid shaded backgrounds, unnecessary borders, patterns and textures, shadows, 3D shapes, and thick or dark gridlines.
Remove those elements one by one and ask whether the chart became less clear. Usually it gets clearer. A few steps that almost always help:
- Delete the legend and label bars, lines, or slices directly. The same guidance notes that legends rely on color to match labels to data, which makes them harder for people with color vision deficiencies.
- Thin out or remove gridlines.
- Highlight the one data point that carries the message in a strong color and keep the rest neutral.
- Put the unit in the title or axis label, such as "USD thousands" or "percent of respondents".
- Round numbers to what the audience needs. A monthly review rarely needs two decimal places.
Take the highlight color from a palette you use across the whole deck. The PowerPoint color palette guide helps you pick combinations that survive a projector, and aesthetic presentation covers clean layouts in general.
Using photos, icons, and diagrams well
Not every visual is a chart. Photos are useful for showing something real, such as a warehouse before and after reorganizing, a new product, or the venue of an event. The photo should show the actual subject you are talking about, and you need the right to use it. Stock photos of smiling people at laptops rarely add understanding.
Icons are good for marking categories that repeat, such as a cart for sales and a truck for delivery. Use one icon style throughout the deck and always pair each icon with a short text label. Choosing and coloring icons is covered in PowerPoint icons.
Flow and cycle diagrams explain processes. SmartArt in PowerPoint speeds this up; the steps are in SmartArt in PowerPoint. Keep it to three to six steps per slide so every box can still hold large text.
For sourcing and preparing photos (resolution, licensing, and cropping), the images for PowerPoint guide lists sources and explains how to keep file size down. Many high-resolution photos inflate the file, so compress them before you email the deck.
Sample outline: a visual presentation for a monthly meeting
Imagine you run a bakery and need to present customer satisfaction survey results at a 10-minute monthly team meeting. A visual outline does not start with charts; it starts with the decisions the meeting needs to make. Here is a topic you could type into an outline builder:
Topic: Visual presentation of customer satisfaction survey results for a bakery's monthly team meetingEvent: MeetingDuration: 10 minutesWe tried that topic in Soluslide. It returned six slides timed at 2, 2, 2, 2, 1, and 1 minutes (10 minutes in total): purpose and decision needed, current survey status, key issues from feedback, improvement options and recommendation, responsibility and timeline, and follow-up.
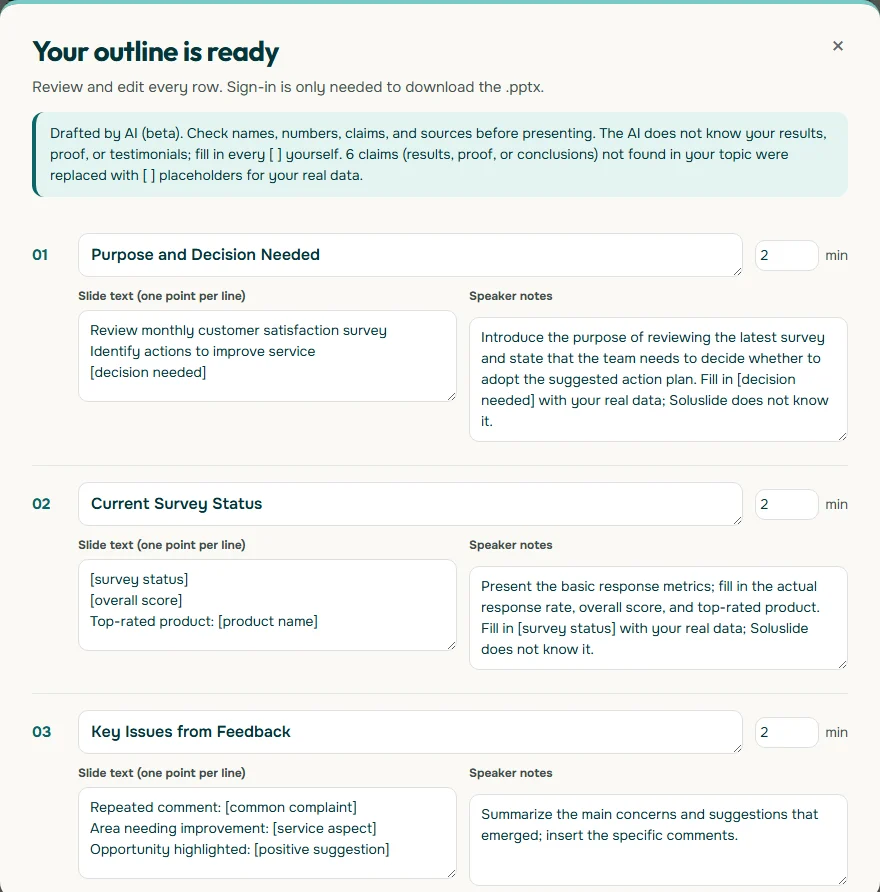
Notice that the survey results are not invented. Slide 02 contains placeholders such as [overall score] that you fill in with real numbers. That is where the chart goes: slide 02 suits a bar chart per service aspect, slide 03 needs only two or three customer quotes, and slide 04 works as a small options table.
Color contrast and sizes people can read
A visual that looks great on a laptop can wash out on a meeting room projector, so check contrast with a number, not by eye. Success Criterion 1.4.3 in the W3C's WCAG 2.2 sets a minimum contrast ratio of 4.5:1 for normal text and 3:1 for large text.
Charts need checking too. The WebAIM Contrast Checker explains that WCAG 2.1 requires a contrast ratio of at least 3:1 for graphics and user interface components. A pale mint bar on a white background may simply disappear. Enter the background and bar colors into the checker to see the ratio before you present.
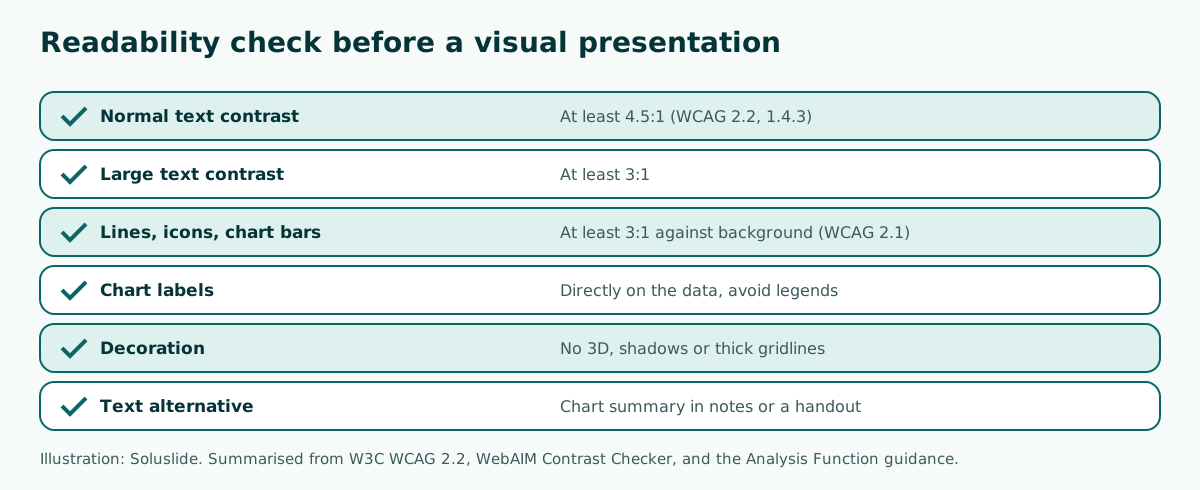
Font size is part of readability as well. The best fonts for presentations guide covers typefaces that stay clear on screen, and readable presentation contrast shows contrast tests on real slides. One easy habit: stand at the back of the room during rehearsal and check whether the chart labels are still legible.
Keeping visuals understandable for everyone
A visual presentation should not leave part of the audience behind. The Analysis Function guidance reminds authors that all data visualisations need a text alternative that serves the equivalent purpose, either a written description or a table. In a live talk, that alternative can be the sentence you say while the chart is on screen, a summary in your speaker notes, or a table in the handout.
Practices that help:
- Do not rely on color alone to separate data. Add labels, line styles, or different positions.
- Say the takeaway out loud, for example "taste scored highest, and most complaints were about delivery time".
- Write a summary of each chart in your speaker notes so it can be shared as text.
- Avoid flashing or very fast animation. If you animate, use it to reveal data step by step, as described in PowerPoint animation.
If you will share the slides after the session, an editable file lets people enlarge fonts or copy tables. File format trade-offs are covered in editable PPTX from AI.
Tools for building a visual presentation
PowerPoint and Google Slides are both good enough for strong visual presentations. In Google's tools, charts usually start from data in Google Sheets: according to Google Docs Editors Help, you select the cells, click Insert, then Chart, and can change the chart type from the Setup panel. The chart can then be added to a slide. Moving decks between the two apps is covered in convert Google Slides to PowerPoint.
AI outline builders help at the start, when you do not yet know the right slide order. Soluslide drafts titles, bullet points, speaker notes, and minutes per slide from a topic or document; you edit the outline before signing in and downloading an editable .pptx. You still choose the charts and photos yourself, based on your real data. A comparison of tools is in AI presentation maker.
Whatever the tool, the process stays the same: message first, evidence second, visual third, then the readability check. Tools only speed up the first two steps.
Summary: steps to a visual presentation
An effective visual presentation is not about the number of images; it is about how fast the audience gets the point. The steps in short:
- Write each slide title as a message sentence.
- Collect real evidence for each message.
- Choose the visual: bars for comparisons, lines for trends, pies only for five categories or fewer with one dominant.
- Simplify charts: direct labels, no 3D, bar axes starting at zero.
- Check contrast: 4.5:1 for text, 3:1 for large text and graphics.
- Prepare a text summary for every chart.
If you would like to start from an outline, draft one in the Soluslide outline builder, then add your real data and charts. To go further, read how to make a presentation interesting and how to give a good presentation.
Frequently asked questions
What is a visual presentation?
A visual presentation carries its main message through charts, images, diagrams, and layout while the speaker explains in words. The slides act as evidence people can grasp at a glance, not as a script.
How do you make a good visual presentation?
Write each slide message as one sentence, gather real evidence, pick the visual that fits, and remove decoration. Then check contrast and font size from the back of the room.
When should I use a pie chart?
The Analysis Function guidance says to use a pie chart only with five categories or fewer that add up to a meaningful whole and include one dominant category. If the slices are similar in size, use a bar chart.
Does a bar chart axis have to start at zero?
Yes. Breaking the value axis on a bar chart distorts the proportions between bars, so small differences look large. If you need to zoom in, choose a different chart type.
What contrast ratio should slide text have?
WCAG 2.2 sets at least 4.5:1 for normal text and 3:1 for large text. Graphics such as chart bars and icons should reach at least 3:1 against the background.
How many images should one slide have?
There is no fixed number, but each slide should carry one message and one main visual. Several unrelated photos on one slide leave the audience unsure where to look.
Do 3D effects make charts more engaging?
No. 3D effects, shadows, and heavy gridlines make charts harder to read, and the Analysis Function guidance recommends avoiding them.
Can AI create a visual presentation?
AI tools can draft the outline, titles, and speaker notes. The data, charts, and photos still need to come from your real sources so the presentation stays accurate.
Sources
Factual claims in this article refer to the sources below. Sample outlines and prompts are illustrations to adapt.
Related reading
Try shaping your own outline. You can review and edit it before signing in.
Build a free outline